The Land of the Free, On Installment: How the American Dream Became a Debt Trap
Total U.S. household debt reached a record 18.388 trillion dollars in 2025. The promise of the Dream was upward mobility. The reality, for most people, is a payment schedule that ends only when they do.

Picture the American Dream as it was sold to you: work hard, climb the ladder, own the home, retire comfortably. Now look at the receipt. Total U.S. household debt reached a record 18.388 trillion dollars in the Federal Reserve Bank of New York's 2025 Household Debt and Credit Report. The promise of the Dream was upward mobility. The reality, for most people, is a payment schedule that ends only when they do.
This is the argument worth making plainly: for a majority of Americans, the Dream now functions less as a ladder than as a leash. It is a system of wage labor and debt dependency dressed up in the language of freedom and opportunity. Most people are not building wealth. They are servicing obligations, renting their own lives back from lenders one paycheck at a time, and they have been taught since childhood to call this normal. The numbers tell that story coldly, so let the numbers talk.
The On-Ramp: How the Trap Opens at Eighteen
The cycle begins before most people have held a full-time job. The college pitch is delivered to teenagers as common sense: borrow now, earn more later, the debt pays for itself. So they sign. Americans now owe roughly 1.84 trillion dollars in student loan debt across 42.8 million federal borrowers, with the average borrower carrying 43,570 dollars in combined federal and private student debt. Student loans have become the second-largest consumer debt category in the United States, behind only mortgage debt.
Consider what that means at the level of a single eighteen-year-old. Of the Class of 2024, 47 percent of bachelor's degree recipients graduated with debt, leaving school with an average of 29,560 dollars. That figure is climbing fast: NerdWallet projects the Class of 2026 will average 43,500 dollars. The debt arrives years before the income that was supposed to justify it. A twenty-two-year-old walks across a stage, shakes a hand, and walks into a repayment plan that will follow them through marriage, children, and middle age. Federal data show that the average monthly student-loan payment is 277 dollars, but the more honest detail is who still carries the balance: borrowers aged 35 to 49 hold the largest share of outstanding balances. The debt taken on at eighteen is, for a vast number of people, still being paid in their forties.
The Reality: A Nation Living One Paycheck Deep
Once you are working, the Dream is supposed to deliver security. It does not, for most. Some 67 percent of Americans say they live paycheck to paycheck, according to PYMNTS Intelligence, a lifestyle that spans income brackets, education levels, and professions. Other surveys land in the same neighborhood. The point is not the precise figure but the floor it establishes: a majority of the country needs the next check to cover the obligations of this one.
The reflexive response is that these people simply spend too much, that this is a discipline problem. The data dismantle that excuse. In LendEDU's 2025 survey, 40.1 percent of people said they could not cover a 1,000 dollar emergency in cash. The national personal savings rate sat at just 4.6 percent in early 2025. This is not the profile of a profligate nation. It is the profile of a nation with no margin.
The most revealing fact is that earning more does not free you. Paycheck-to-paycheck living spans all income levels, including half of high earners, defined as those making 100,000 dollars or more, as of January 2025. A Harris Poll found that 64 percent of Americans earning six figures say their income merely keeps them afloat. If a 100,000 dollar salary, the supposed marker of having made it, leaves you running in place, then the problem is not located inside the household budget. It is built into the machine. The Dream told you the ladder had a top. For most climbers, every rung is the same height above the water.
The Squeeze: Why Working Harder Stopped Working
Here is the engine underneath all of it. Pay has come unhooked from the value workers produce. The Economic Policy Institute's central finding is that productivity growth has outpaced the wages of the vast majority of workers since 1979. Run that gap forward and the loss is staggering: EPI calculates that had low-end wages grown in line with productivity since 1979, the 10th-percentile hourly wage would be 45 percent higher, and the median wage would be 43 percent higher, at 36.69 dollars instead of where it sits now. Workers generated the growth. Someone else kept it.
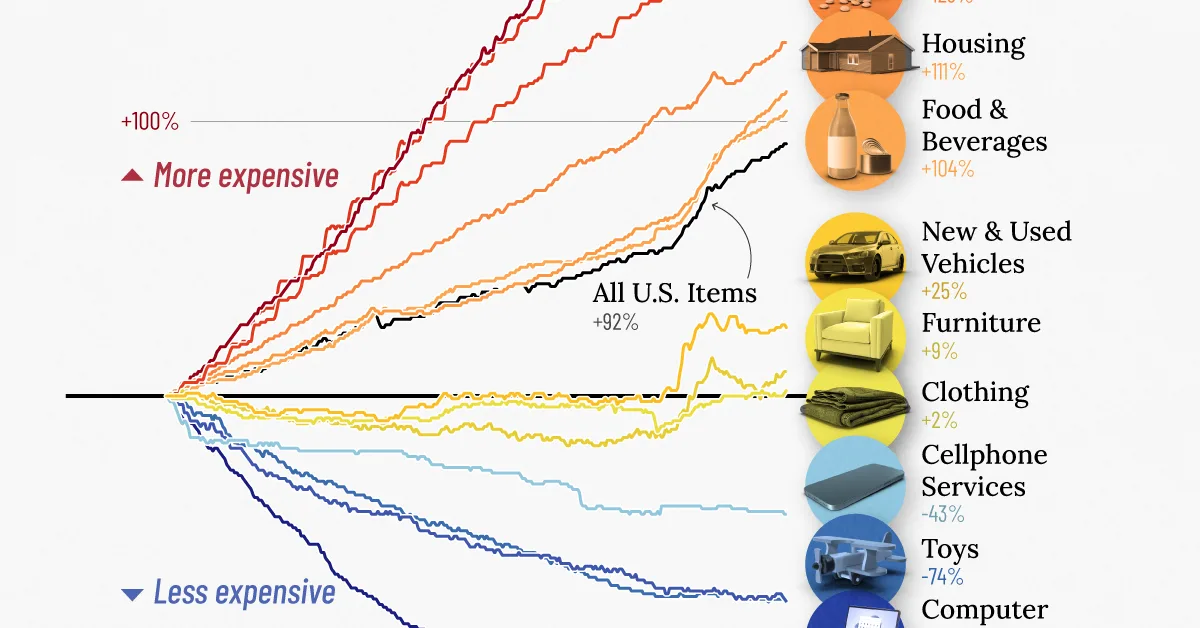
Meanwhile the cost of simply existing kept climbing. Even in the recent stretch where wages supposedly recovered, the math stayed brutal: from January 2021 to mid-2025, average hourly earnings rose 21.8 percent while the Consumer Price Index rose 22.7 percent, leaving real wages down 0.7 percent cumulatively. You worked through years of "strong" headline numbers and ended up slightly poorer in real terms. This is the same quiet erosion we documented in our analysis of how your money is worth less than they are telling you.
And the essentials, the things you cannot opt out of, rose fastest of all. The median U.S. home price hit 414,000 dollars in 2025. A genuinely comfortable life is now luxuriously expensive: MIT's Living Wage Calculator and EPI both show a comfortable lifestyle for a family of four can easily top 100,000 dollars in many states. This is why the debt exists. It is not buying yachts. Essential costs like car repairs, medical bills, home repairs, and everyday living make up nearly three-quarters, about 73 percent, of credit card balances nationwide. When wages stall and rent and groceries and insurance do not, the gap gets filled with borrowed money. That is the whole story in one sentence.
The Cage: Where the Borrowed Money Goes to Die
Filling that gap with credit is where survival curdles into permanent dependency. Total U.S. credit card debt stood at 1.252 trillion dollars as of the first quarter of 2026, after hitting the highest balance on record at 1.277 trillion dollars in late 2025. Card balances have risen by 482 billion dollars since 2021, a 63 percent jump in five years. Among cardholders who carry a balance, the average is 7,886 dollars.
This is not a brief stumble for most who fall into it. Sixty-one percent of Americans with credit card debt have been carrying it for at least a year, up from 53 percent in 2024, including 31 percent in debt for three or more years and 21 percent for five or more. And the people inside it can feel the bars. More than 2 in 5 cardholders, around 41 percent, say their debt began with an emergency expense, and 22 percent of debtors do not believe they will ever pay it off.
That last number is the quiet confession at the heart of the whole arrangement. One in five people in credit card debt have privately concluded the door is locked. They are not planning an escape. They are planning to live inside it.
The Conditioning: How They Taught You to Call This Freedom
A system this extractive could not survive if people recognized it for what it is. So the culture does the work of making it invisible. The most striking finding in NerdWallet's 2026 study is not a dollar figure at all: about half of Americans, 49 percent, say carrying revolving credit card debt is normal. Half the country has been taught to treat lifelong interest payments to financial institutions as an ordinary feature of being alive, like weather.
The conditioning starts early and runs deep. Lenders count on it. By eighteen, the same age the college loan paperwork appears, a young adult can also open a credit card. By eighteen, between that card and a first auto loan, the average young adult already starts adult life carrying 20,718 dollars in debt. The full arc is laid out in a JG Wentworth analysis: across a lifetime, the average American accumulates roughly 1,786,810 dollars in total debt across mortgages, auto loans, credit cards, and student loans, with the load peaking at age 61. You are taught to enter adulthood in debt, spend your prime earning years in debt, and approach retirement at your most indebted. And you are taught to call each stage a milestone. The first car. The diploma. The house. Each one a celebration, each one a fresh lien.
When the script tells people that "budget better" and "cut the lattes" is the answer, it is performing its real function, which is to relocate a structural failure into your personal character. But when a third of people in card debt say it came from groceries and utilities, the budgeting advice is not just unhelpful, it is a misdirection. The math is broken, and "budget better" is not the answer. The genius of the conditioning is that it makes the indebted feel ashamed instead of angry, and shame keeps people quiet, and quiet people keep paying.
Who Profits: Follow the Interest
Every dollar of this is someone's revenue. That is the part the Dream never mentions. Your 18.4 trillion dollars in household debt is not a national burden floating in the abstract. It is an income stream flowing, reliably and at 22 percent, into the institutions that hold the paper. Wage stagnation is not a market accident either; EPI is blunt that wage stagnation is the direct result of public policy choices made on behalf of those with the most power and wealth. The pay that did not reach workers did not vanish. It pooled at the top.
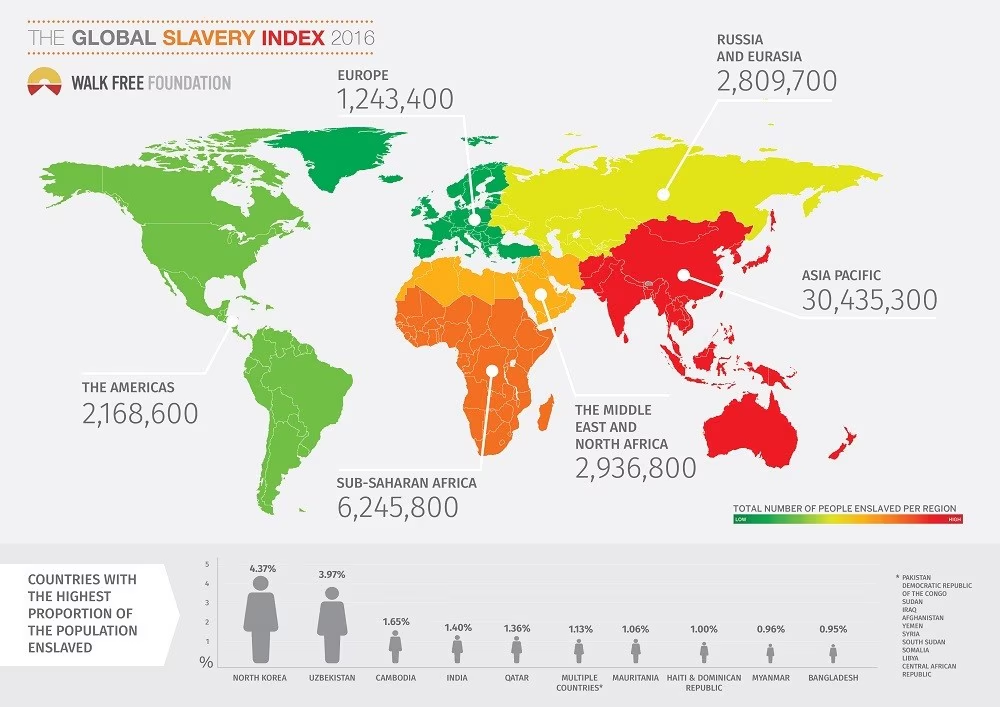
This is the architecture: hold wages down, let the cost of essentials rise, offer credit to bridge the gap, and collect interest on the bridge in perpetuity. The worker produces value, the value is captured upstream, the worker borrows it back at interest, and the loop closes. Calling the people caught in that loop "modern day slaves" is rhetorically sharp, and the comparison is imperfect because these are not chattel and the chains are contractual rather than literal. But strip the sentiment and look at the mechanics. A person who must sell their labor every two weeks to service obligations they can never fully clear, who has been taught to accept this as normal and to blame themselves when it hurts, is not living the Dream of mobility. They are running a treadmill that someone else profits from. The mechanics of value captured upstream are not unique to consumer debt; we traced the same logic through global production in our investigation into how modern slavery fuels technology supply chains and the longer history of slavery's enduring role in powering empires and modern supply chains.
The Counterargument, and Why It Holds for the Few
The strongest objection deserves a fair hearing, because it is partly true. Debt, the argument goes, is a tool, not a trap. A mortgage builds equity. A student loan that buys a real credential can lift lifetime earnings well past its cost. A business loan creates an asset. Used well, leverage is the oldest engine of upward mobility there is, and millions of Americans have used it exactly that way.
This is correct, and it is also the trap's best disguise. Debt is a tool the way a ladder is a tool: it lifts you only if you have the footing to climb. For those entering with family wealth, strong wages, and a margin for error, debt genuinely is leverage. The data confirm there is an exit door, and that some walk through it. In 2025, 58 percent of those actively trying to pay down debt succeeded in reducing their balance.
But notice what the tool argument quietly assumes: that the borrower has the surplus to make leverage work. Most do not, and the same numbers prove it. When 40 percent of people cannot find 1,000 dollars in an emergency, the "tool" is not building anything. It is plugging a leak. When the debt comes from car repairs and medical bills and groceries rather than appreciating assets, there is no equity at the end, only interest paid. The defenders of debt-as-mobility are describing the experience of the minority with footing and generalizing it to a majority without. The tool works for the few who were already climbing. For everyone else, the same tool is the thing holding them in place. A system that delivers mobility to those who least needed the help, and a lifetime of payments to those who needed it most, is not a ladder. It is sorting.
The Punch
So here is the Dream, fully itemized. You are taught at eighteen to borrow for a future that arrives pre-mortgaged. You enter a labor market where productivity climbs and your wages do not. You meet a cost of living that swallows even a six-figure salary, so you reach for credit, where 22 percent interest ensures the balance outlives your good intentions. You do this for decades, and the culture stands beside you the entire time whispering that this is normal, that the failure is yours, that you should simply budget harder. And at the far end, at sixty-one, you are more in debt than you have ever been.
The American Dream was supposed to be the promise that work sets you free. For most Americans it has quietly become the opposite arrangement: work that keeps you owing, and owing that keeps you working. The chains are made of paper and signed in your own hand, which is precisely why they are so hard to see. The first act of getting free is refusing to call the cage a Dream.
Frequently Asked Questions
How much debt do American households actually carry?
Total U.S. household debt reached a record 18.388 trillion dollars in the Federal Reserve Bank of New York's 2025 Household Debt and Credit Report. That total spans mortgages, auto loans, student loans, and credit cards. A JG Wentworth analysis estimates the average American accumulates roughly 1,786,810 dollars in total debt across a lifetime, with the load peaking at age 61. The structural pattern is that people are taught to enter adulthood in debt, spend their prime earning years in debt, and approach retirement at their most indebted.
Why do so many Americans live paycheck to paycheck even at high incomes?
Roughly 67 percent of Americans say they live paycheck to paycheck, according to PYMNTS Intelligence, and the pattern spans income brackets. Paycheck-to-paycheck living includes about half of high earners making 100,000 dollars or more as of January 2025, and a Harris Poll found 64 percent of six-figure earners say their income merely keeps them afloat. The reason is structural rather than personal: wages have come unhooked from the value workers produce, while the cost of essentials has climbed faster than pay.
What is the gap between wages and productivity?
The Economic Policy Institute finds that productivity growth has outpaced the wages of the vast majority of workers since 1979. Had low-end wages grown in line with productivity since then, EPI calculates the 10th-percentile hourly wage would be 45 percent higher and the median wage 43 percent higher, at 36.69 dollars an hour. From January 2021 to mid-2025, average hourly earnings rose 21.8 percent while the Consumer Price Index rose 22.7 percent, leaving real wages down 0.7 percent cumulatively. Workers generated the growth, but it pooled at the top.
Why is credit card interest described as a trap?
Total U.S. credit card debt stood at 1.252 trillion dollars in the first quarter of 2026, after a record 1.277 trillion dollars in late 2025. The average APR on interest-bearing accounts was 22.3 percent as of late 2025, so balances compound rather than retreat. NerdWallet calculated that paying only the minimum on the average balance would accrue nearly 18,500 dollars in interest before payoff. About 61 percent of Americans with card debt have carried it at least a year, and 22 percent of debtors do not believe they will ever pay it off.
Is debt always a trap, or can it be a tool for mobility?
Debt genuinely can be leverage. A mortgage builds equity, a degree that buys a real credential can lift lifetime earnings, and a business loan creates an asset. In 2025, 58 percent of those actively trying to pay down debt succeeded in reducing their balance. But that argument assumes the borrower has a surplus to make leverage work. When 40 percent of people cannot cover a 1,000 dollar emergency and roughly 73 percent of card balances come from essentials like car repairs, medical bills, and groceries, the borrowing plugs a leak rather than building equity. The tool works for the few already climbing, and holds everyone else in place.
Kai Tutor | The Societal News Team
Follow Us!
It helps decentralize our presence across the web and it's completely free!
Instagram ➤
Youtube ➤
Substack ➤
X.com ➤
Telegram ➤
TikTok ➤
Sources: JG Wentworth, "Life of Debt" | Debt.org, "American Household Debt: Statistics and Demographics" | Get Out of Debt Guy, "U.S. Student Loan Debt Statistics 2026" | LendingTree, "U.S. Student Loan Debt Statistics" | Education Data Initiative, "Student Loan Debt Statistics" | Credible, "Average U.S. Student Loan Debt" | PYMNTS, "Who Is the Paycheck-to-Paycheck Consumer in America?" | LendEDU, "Living Paycheck to Paycheck: 2025 Statistics" | EPI, Harris Poll clip on six-figure earners | EPI, "Low-wage workers faced worsening affordability in 2025" | EPI, "The Productivity-Pay Gap" | Visual Capitalist, "U.S. Wages vs. Inflation (2021-2025)" | Academy Bank, average credit card debt statistics | The Motley Fool, "Average American Credit Card Debt" | LendingTree, "2026 Credit Card Debt Statistics" | Bankrate, "2026 Credit Card Debt Report" | Get Out of Debt Guy, on Bankrate's 2026 debt report | NerdWallet, "2025 Household Credit Card Debt Study" | LendingTree, "Financial Outlook Survey" | CNN Business, "1 in 4 US households living paycheck to paycheck"