Your Money Is Worth Less Than They're Telling You
The government says prices are fine. 90% of Americans disagree.
You've heard it a hundred times. Inflation is "cooling." The economy is "strong." The worst is "behind us." Officials deliver these lines with straight faces while you're standing at the grocery store doing mental math, wondering how your cart got this expensive.
You're not bad at budgeting. You're not imagining it. The data backs you up. You just have to know where to look, because the number they lead with every month is built to tell the most comfortable version of the story.
This is not a partisan article. This is a numbers based article. And the numbers are ugly. The same forces driving up your grocery bill are also behind hidden taxes at the gas pump and the broader chemical and pharmaceutical burden documented in Medicated America. The cost of living crisis is not one story. It is many stories running simultaneously.
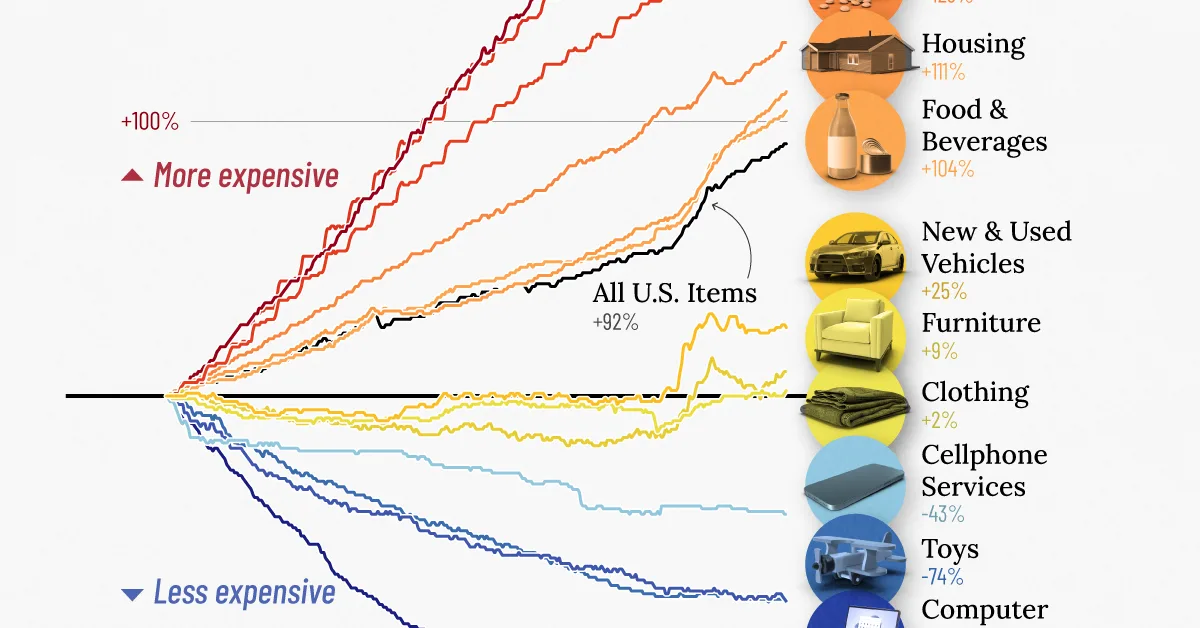
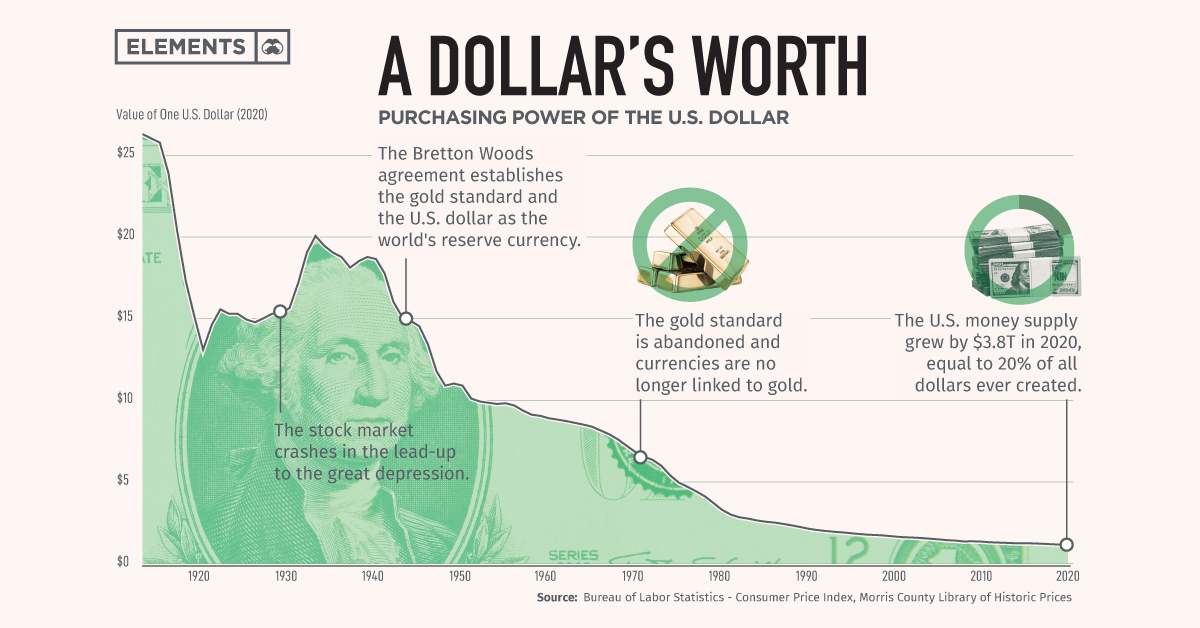
What $100 in 2000 Buys Today
Before we even get to the post-pandemic chaos, let's zoom out to the year 2000.
That is a crisis. The remarkable grinding of inflation over 26 years. Half your purchasing power, gone. Quietly. Legally. In the background, while everyone was busy watching headlines about annual rates.
Now stack the pandemic era on top of that.
So to summarize your situation since the year 2000, the dollar has lost roughly half its value. The last five years contributed the most violent chunk of that loss in recent memory. And when you turn on the news, they tell you inflation has "come down" to around 3%.
That 3% is the rate of new damage. The old damage is still there, compounding every year.
What They're Actually Measuring, and What They're Not
When the government says "inflation is 3.3%," they're describing how much faster prices rose compared to last year. They are not saying prices went down. They are not saying your 2020 losses were recovered. They are saying the bleeding slowed.
Here is the trap most people fall into: they hear "inflation is down" and assume things got cheaper. Things did not get cheaper. A grocery cart that jumped from $100 to $130 during the inflation surge does not go back to $100 just because inflation cooled to 3%. It goes from $130 to $133.90. The new number is always built on top of the old one.
There is also a structural problem with how the government builds the inflation number in the first place.
The most-reported figure is the Consumer Price Index, or CPI. It is supposed to represent a "basket of goods" that a typical American buys. But economists and the Fed have a preferred version called "core inflation" that strips out food and energy entirely. The stated reason is that food and energy prices are "volatile." The practical effect is that the inflation measure used to set national policy is the one that excludes your grocery bill and your gas tank.
The measurement tool used to convince you things are fine is built in a way that structurally undercounts the cost of the two things that take the biggest bite out of your paycheck: food and housing.
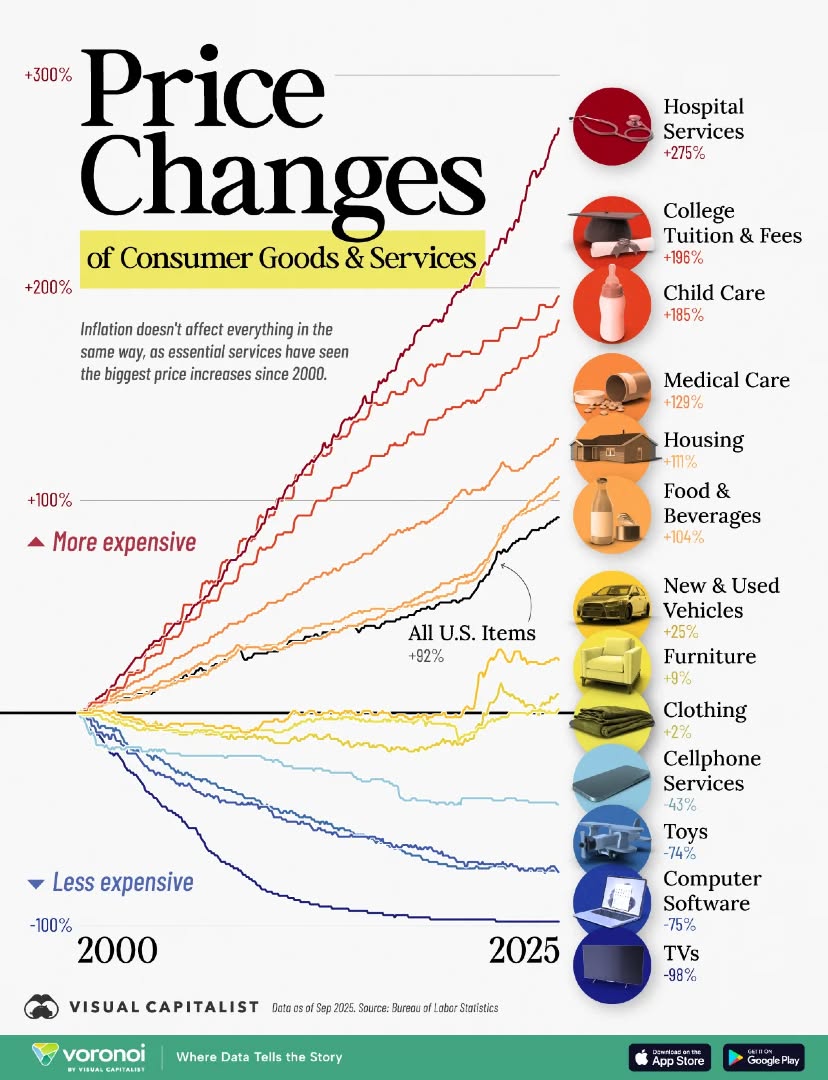
What Actually Got Expensive
Let's look at specific things.
Groceries
U.S. food-at-home prices increased 24% between January 2020 and January 2023. That's in three years. Then they kept climbing. Beef and veal prices jumped 14.7% in the year ending September 2025 alone, and a survey found that 90% of American adults are stressed about the cost of groceries. Coffee and tea prices rose 11.8% in 2025. Utility gas rose 10.8%. Electricity climbed 6.7%. Hospital and related services rose 6.7%, the largest increase since 2010.
Housing
Renters are not better off. Rent is up 28.9% since the pandemic. In cities like Miami and Tampa, rents surged over 60%. Phoenix saw one-bedroom rents jump 53%. Even markets that were considered affordable before 2020 were swept up entirely in the surge.
Cars
Motor vehicle insurance is up 56.6% since the start of the pandemic. Vehicle repair costs are up 58.4%. New vehicles are nearly 20% more expensive. Used vehicles are 30.5% more expensive. If you own a car, and roughly 92% of American households do, you have been hit by all of these costs simultaneously.
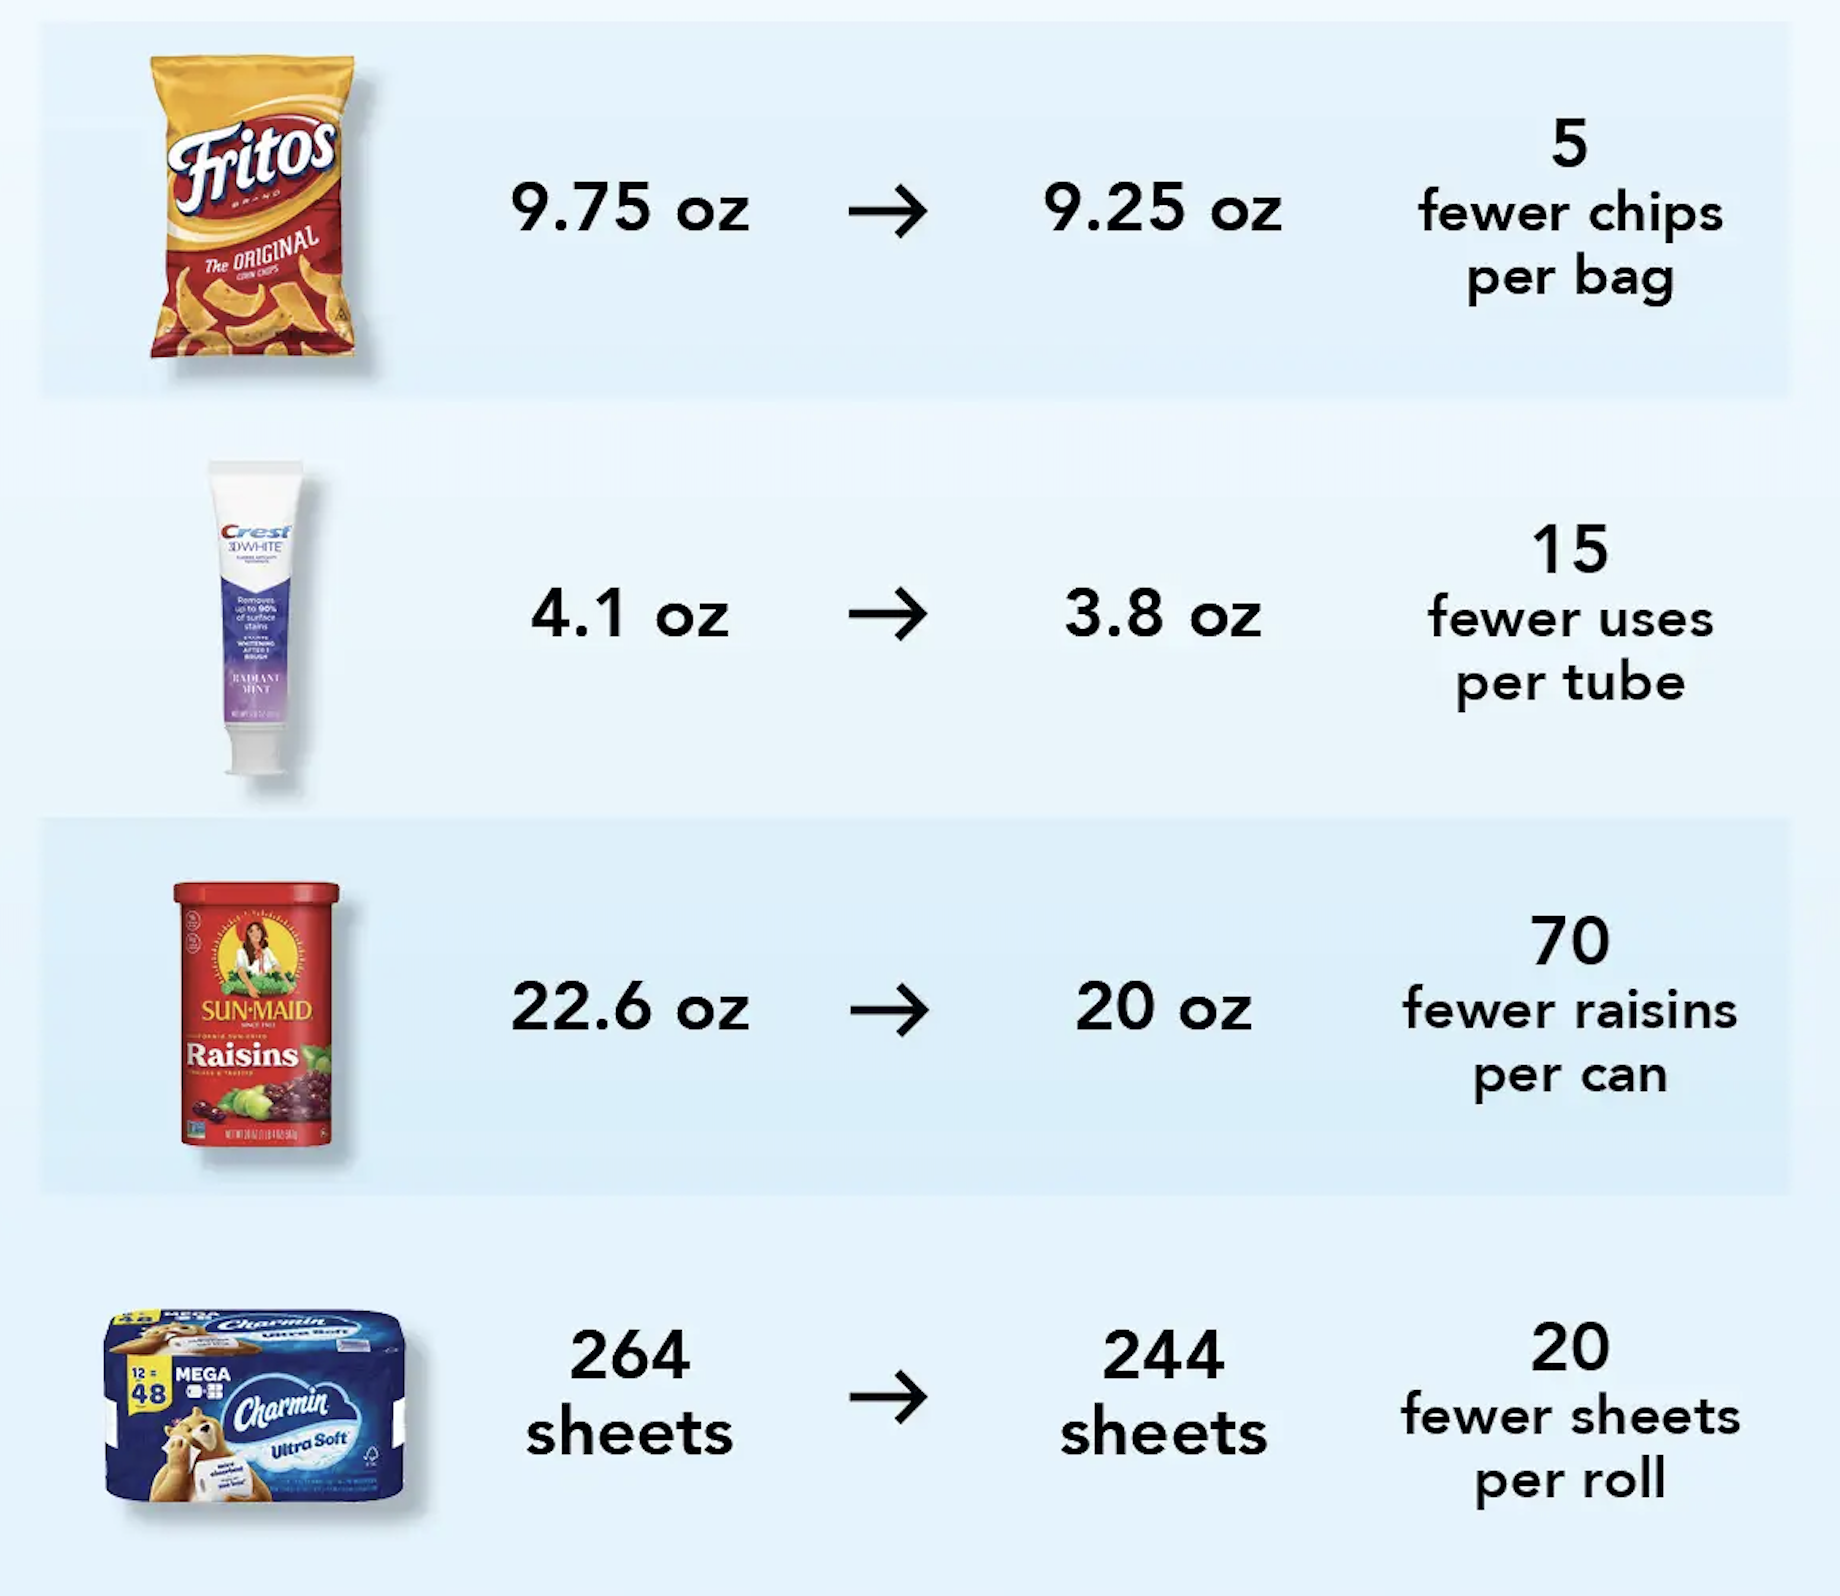
Shrinkflation
There is a second form of price increase that does not show up in official inflation numbers at all, because technically the price did not change. The package just got smaller.
Companies in the food and beverage industries raise the price per given amount by reducing the size or quantity of a product while keeping the price the same or higher. Products that undergo the most shrinkflation include toilet paper, cereal, yogurt, laundry detergent, and shampoo.
This is not accidental and it is not subtle. Corporate executives have discussed it openly in investor calls. In February 2022, Hershey's CEO described investing in "price pack architecture" as a way to generate price increases without raising the list price. By April 2023, Hershey's CFO stated the company wanted to continue putting upward pressure on margins through packaging strategies as part of their growth formula.
They called it a growth formula. You called it buying less chocolate for the same money.
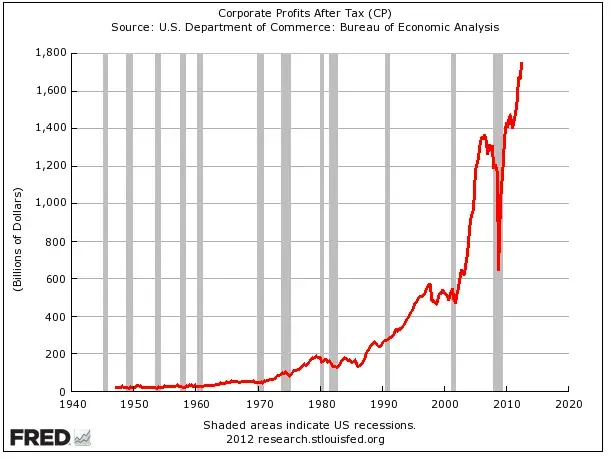
Corporate Profits
The most politically charged question of the post-2020 inflation era is whether corporations used supply chain chaos as cover to pad their margins. The data is not clean, but it points in one direction consistently enough to be worth taking seriously.
Not every economist agrees on the scale of this effect across the entire economy. Some researchers at the San Francisco Fed found that economy-wide, corporations did not appear to be the primary driver. But the argument that some large companies in specific sectors, including food, energy, and consumer goods, used the inflationary environment to increase margins beyond their cost increases is supported by multiple bodies of research, including from the Fed itself.
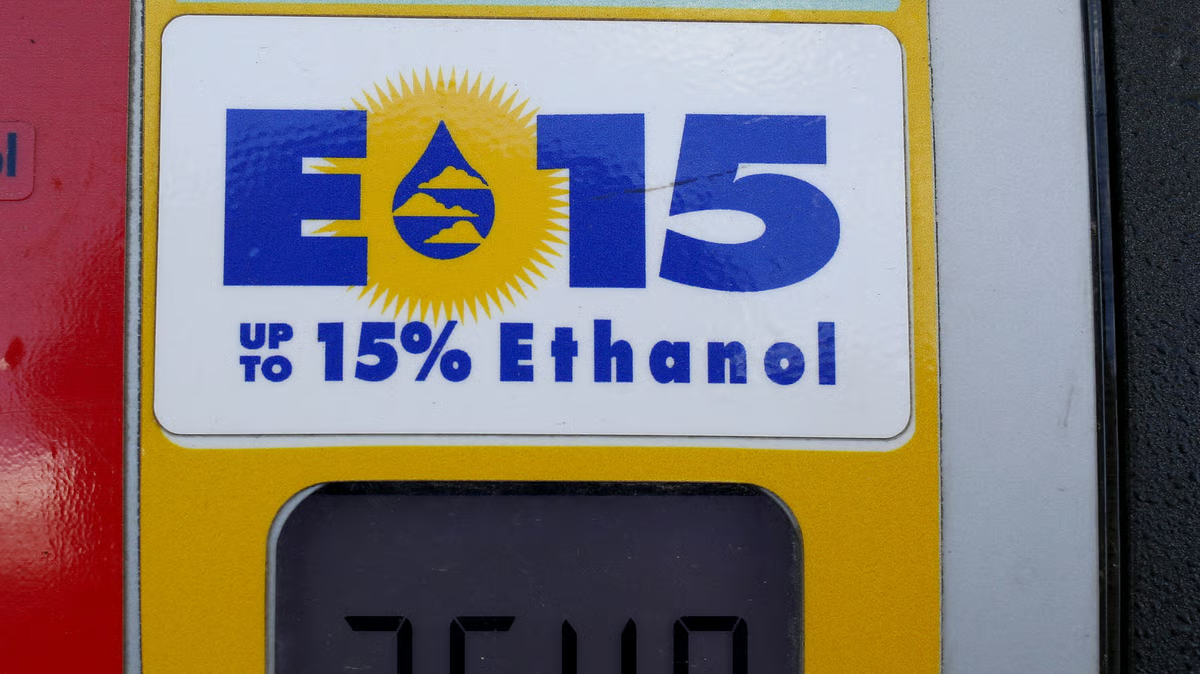
What matters for the average person is simple: when wholesale costs went down for many of these companies in 2023 and 2024, prices at the store did not follow. The extra margin got kept. The price stayed. This pattern of corporate capture of consumer budgets is not limited to groceries. It shows up in fuel policy too, as our analysis of the E15 ethanol waiver documents in detail.
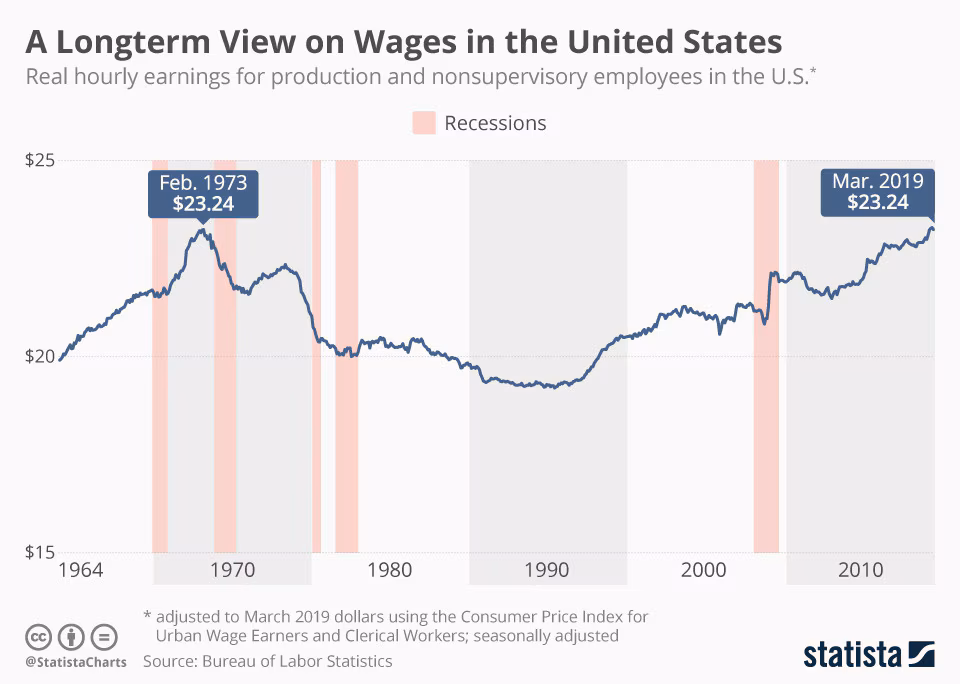
The Wage Problem Goes Back to 2000, and Beyond
The conversation about wages and inflation usually focuses on the last few years. But the real story stretches back much further.
Read that again. Workers appeared to get massive raises over 20 years. In reality, after inflation, they got 11.9% more purchasing power across two decades.
During the worst of the inflation surge, wages fell behind completely. From April 2021 to April 2023, average real hourly earnings declined for 25 consecutive months on a year-over-year basis. That is over two straight years of workers technically getting raises but losing ground on what those raises could buy.
The people earning $7.25 an hour in 2009 were earning the equivalent of about $10.25 in today's money when measured against what that $7.25 could actually buy. Today they still earn $7.25. That is not a raise. That is a pay cut that happened slowly enough that Congress never had to vote for it.
Who Gets Hit the Hardest
Inflation is not an equal-opportunity problem. In 2023, food costs ranged from 32.6% of after-tax income for households in the lowest income quintile, those earning under $16,171 a year, to 8.1% for the highest income quintile.
When eggs go up 40%, a household earning $200,000 a year barely blinks. A household earning $28,000 a year is deciding what to cut. When rent goes up 30%, a high earner renegotiates or buys. A low-wage renter moves farther away from their job, or doesn't move at all because they can't afford first and last month's rent plus a deposit anywhere better.
Why the Official Story Stays Optimistic
There are structural reasons why the inflation narrative from politicians, financial media, and economists tends toward reassurance rather than alarm.
First, "core inflation" strips out food and energy by design. The logic is that these are volatile and distort the underlying trend. The result is that the measure used to guide Federal Reserve policy is the one that most reliably excludes what ordinary people spend the most of their income on.
Second, the annual rate comparison gets mathematically easier over time all on its own. When 2022 had 9% inflation and 2023 was measured against that already-elevated baseline, a 3% reading looked like a triumph. But it was 3% on top of 9% on top of years of compounding before that. The comparison flatters the number.
Third, the financial press and political class are genuinely invested in confidence. Markets go up when consumers feel good. Approval ratings go up when the economy feels stable. The people who are worst hurt by persistent high prices, working-class and lower-income households, are not the ones being interviewed on financial television, and they are not the ones whose portfolio performance is being tracked.
People know. They feel it every week. The gap between what they are told and what they experience at the checkout line, the rent office, and the gas station is not a misunderstanding. It is a gap between a carefully selected number and a lived reality.
The Bottom Line
Here is an honest accounting of where things stand.
Since the year 2000, the dollar has lost roughly half its purchasing power. The decade from 2000 to 2010 brought two recessions and no meaningful wage growth for most workers. The decade from 2010 to 2020 brought slow recovery that mostly benefited higher earners and asset holders. Then from 2020 to 2023, prices spiked faster than they had in 40 years, wiping out what wage gains lower earners had made.
The rate of new inflation has slowed. That part is true. But the price level, the actual cost of food, housing, energy, insurance, and healthcare, has not come down. It has kept rising, just more slowly.
When officials say the inflation fight has been won, they mean the rate of increase is approaching the Fed's 2% target. They do not mean prices came back down. They do not mean the damage was undone. They mean the new damage is being added more slowly to a baseline that is already 25 to 92% higher than it was at various points in recent memory.
Many essentials like rent, groceries, and electricity remain more expensive than pre-2020 levels even if they're rising more slowly. Surveys show inflation is still one of Americans' top concerns because the price level, not just the rate of increase, is what most people feel every day.
If you have felt poorer since 2000, the numbers agree with you. If you have felt significantly poorer since 2020, the numbers really agree with you.
The story you're being told is technically true in the narrowest possible sense. The broader truth is that a generation of Americans has watched the purchasing power of their wages erode steadily for 25 years, absorbed the fastest price spike in four decades between 2021 and 2023, and is now being told to feel good because the speed of the damage finally slowed down.
Frequently Asked Questions
How much has inflation increased since 2000?
According to Bureau of Labor Statistics CPI data, prices have risen by nearly 92% since 2000, meaning what cost $100 in 2000 costs about $191.76 today. The dollar now only buys about 52 cents of what it could buy in 2000. On top of that, prices rose an additional 25% between January 2020 and today, more than double the cumulative inflation of the five years before the pandemic.
Why does the government say inflation is low when everything feels so expensive?
The government reports the annual rate of price increases, not the cumulative damage. When officials say inflation is 2.7% or 3.3%, they mean prices are rising that much faster than last year, not that prices have come down. A grocery cart that rose from $100 to $130 during the inflation surge does not return to $100 when the rate slows. It goes from $130 to $133.90. The baseline of damage stays permanently elevated.
What is core inflation and why does it leave out food and gas?
Core inflation is the Federal Reserve's preferred inflation measure. It strips out food and energy prices entirely on the grounds that they are too volatile. The practical effect is that the measure used to set national monetary policy excludes the two categories that consume the largest share of lower-income household budgets: groceries and gas. Critics argue this systematically understates the inflation burden on working-class Americans.
How much have housing costs risen since 2020?
Home prices are up 60% since 2019. The median existing single-family home price hit $412,500 in 2024, which is five times the median household income. Monthly mortgage payments on the median-priced home rose to $2,570, requiring an annual income of at least $126,700 to afford. Rent is up 28.9% since the pandemic nationally, with cities like Miami and Tampa seeing surges over 60%. By 2024, 43.5 million households, one-third of all Americans, were cost-burdened, spending more than 30% of income on housing.
What is shrinkflation and does it count as inflation?
Shrinkflation is the practice of reducing the size or quantity of a product while keeping the price the same or raising it. Because the price tag does not change, shrinkflation does not appear in official CPI measurements, even though consumers are paying more per unit. The Bureau of Labor Statistics estimates that roughly 10% of inflation in some consumer product categories is driven by shrinkflation alone. Common targets include toilet paper, cereal, yogurt, laundry detergent, and snack foods.
Have wages kept up with inflation?
Not for most workers. Since March 2006, nominal average weekly wages rose 78.7%, but after adjusting for inflation, real purchasing power grew only 11.9% across nearly two decades. From April 2021 to April 2023, real wages declined for 25 consecutive months. The federal minimum wage has remained at $7.25 per hour since 2009 and is now worth 29% less in real terms than when it was last raised, and 46% less than its 1968 inflation-adjusted peak.
Did corporate profits contribute to inflation?
Research from multiple sources, including the Federal Reserve Bank of Kansas City and the Groundwork Collaborative's analysis of Commerce Department data, found that corporate profit growth contributed significantly to inflation. Corporate profits rose 75% between 2020 and 2022, five times faster than inflation. The Kansas City Fed found markups accounted for more than half of consumer price inflation in 2021. When input costs fell in 2023 and 2024, many companies kept prices elevated rather than passing savings to consumers.
Kai Tutor | The Societal News Team
Follow Us!
It helps decentralize our presence across the web and it's completely free!
Instagram ➤
Youtube ➤
Substack ➤
X.com ➤
Telegram ➤
TikTok ➤
Sources: U.S. Bureau of Labor Statistics, Consumer Price Index Data (BLS.gov); In2013Dollars.com, Value of 2000 Dollars Today (Bureau of Labor Statistics CPI data); CNBC Make It, "See how much prices have increased since 2020," December 2025; Bankrate, Latest Inflation Statistics, August 2025; USDA Economic Research Service, Food Price Outlook: Summary Findings, 2026; USDA Economic Research Service, Food Price Inflation Slowed in 2023 and 2024, June 2025; Visual Capitalist, Visualized: U.S. Inflation by Category in 2025, November 2025; Harvard Joint Center for Housing Studies, The State of the Nation's Housing 2025; Harvard Joint Center for Housing Studies, Housing Unaffordability Soared to New Highs in 2024, February 2026; The World Data, Rent Increase Statistics in the US 2020-2025; Bipartisan Policy Center, Answering FAQs on Housing Costs and Inflation; NBER Working Paper 34113, Ball and Koh, Market Rents and CPI Shelter Inflation, 2025; Roosevelt Institute, The Persistence of Post-pandemic Shelter Inflation, March 2025; Michigan Journal of Economics, Shrinkflation 101, April 2024; Groundwork Collaborative, Big Profits in Small Packages, March 2024; U.S. Senate, Shrinkflation Prevention Act of 2024, Congress.gov; Fortune, January 2024; Federal Reserve Bank of Kansas City, corporate markup research, 2021-2022; Visual Capitalist / USAFacts, Are U.S. Wages Keeping Up With Inflation?, June 2025; Statista, U.S. Wages Haven't Kept Up With Inflation, February 2026; National Employment Law Project, Minimum and Living Wage, December 2025; Center for Economic and Policy Research, 2024; Truth in Accounting, September 2025; University of Michigan, Consumer Sentiment Survey, 2025-2026; and others.